刘斌的博客


  • Home

  • Archives

geoserver发布china DEM

Posted on 2020-03-14 | | Visitors:

geoserver服务搭建

利用docker镜像启动,最好使用docker-compose的脚本。

下载 srtm90m分辨率也地形数据

我下载了覆盖中国区域的6个分区,解压后,将tif放入 geoserver的data目录下,新建一个dem目录。

geoserver中发布ImageMosaic数据存储,并发布图层

填写名名称,URL在目录浏览中选择dem目录

发布图层,启动所在工作区的WMS服务

应该可以在Layer preview 中预览图层了
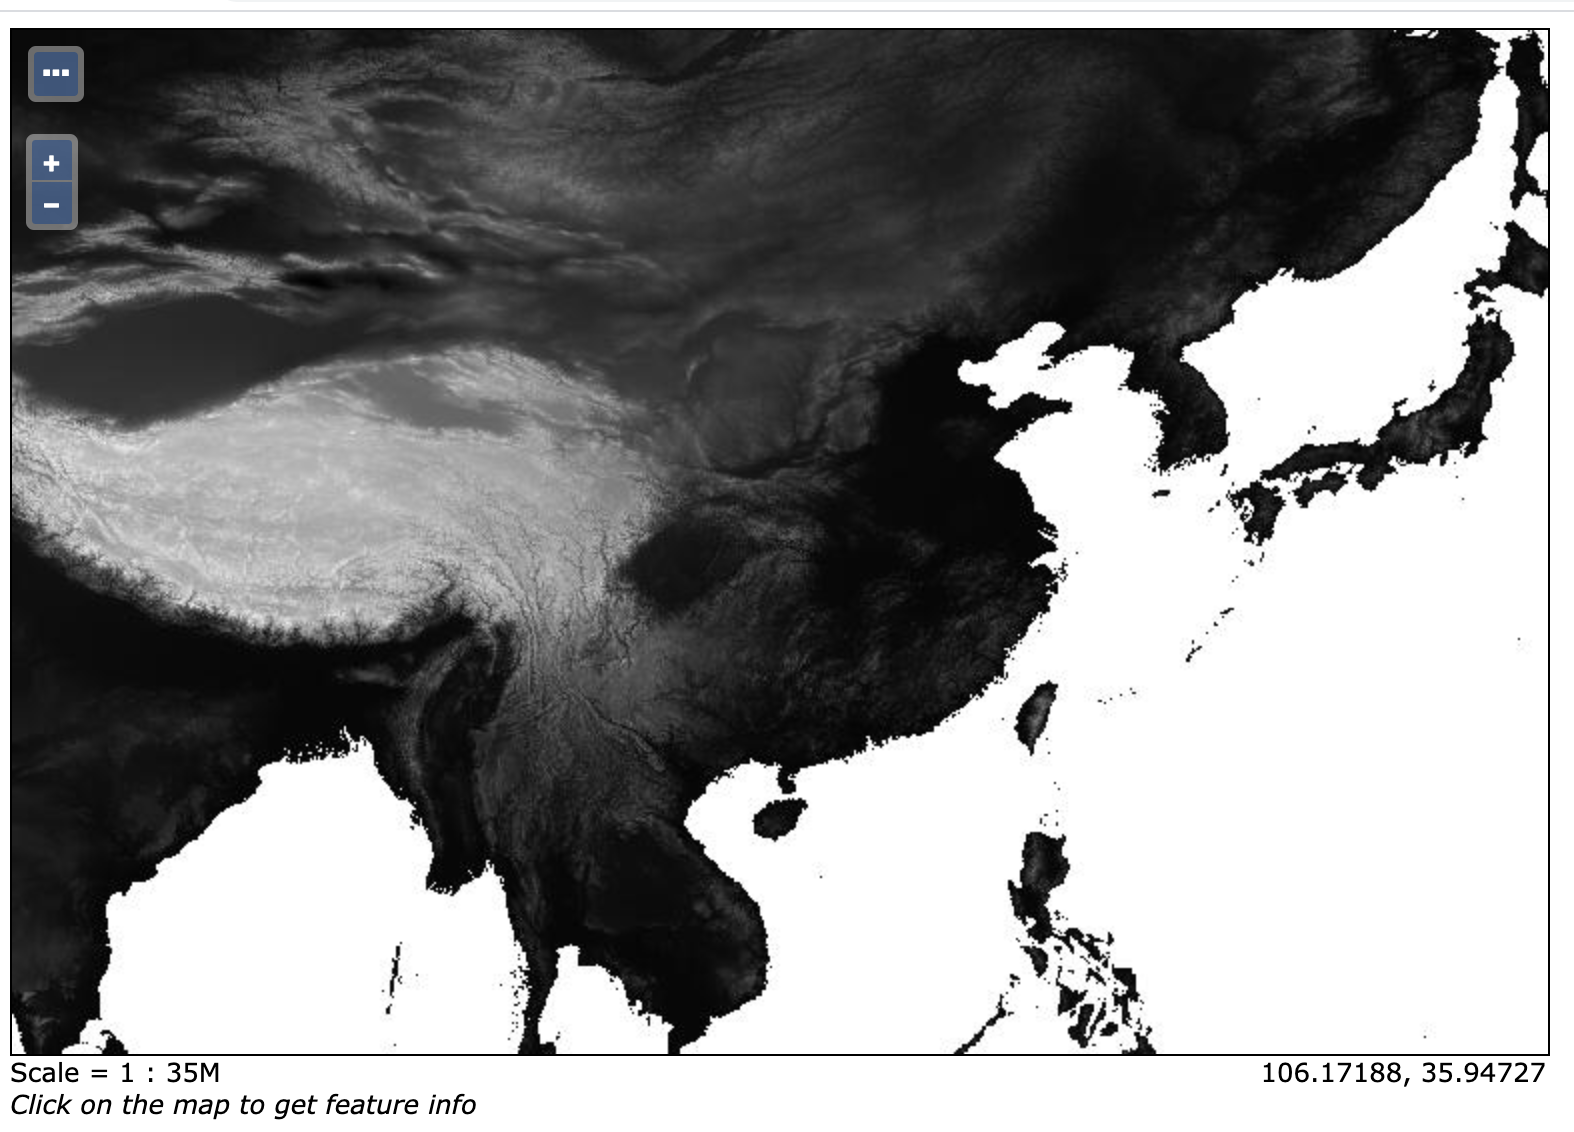
获取任意的的高程数据

发布完WMS服务后,可以利用GetFeatureInfo获取任意经纬度的高程。
api的格式为
http://URL地址/geoserver/工作区名称/wms?SERVICE=WMS&VERSION=1.1.1&REQUEST=GetFeatureInfo&QUERY_LAYERS=工作区名称%3A图层名称&LAYERS=工作区名称%3A图层名称&exceptions=application%2Fvnd.ogc.se_inimage&INFO_FORMAT=application%2Fjson&X=50&Y=50&SRS=EPSG%3A404000&STYLES=&WIDTH=101&HEIGHT=101&BBOX=98.40248107910158%2C26.647682189941406%2C107.27943420410158%2C35.524635314941406

利用图层组,发布多图层的服务。

gdaldem 生成 hillshade 图层

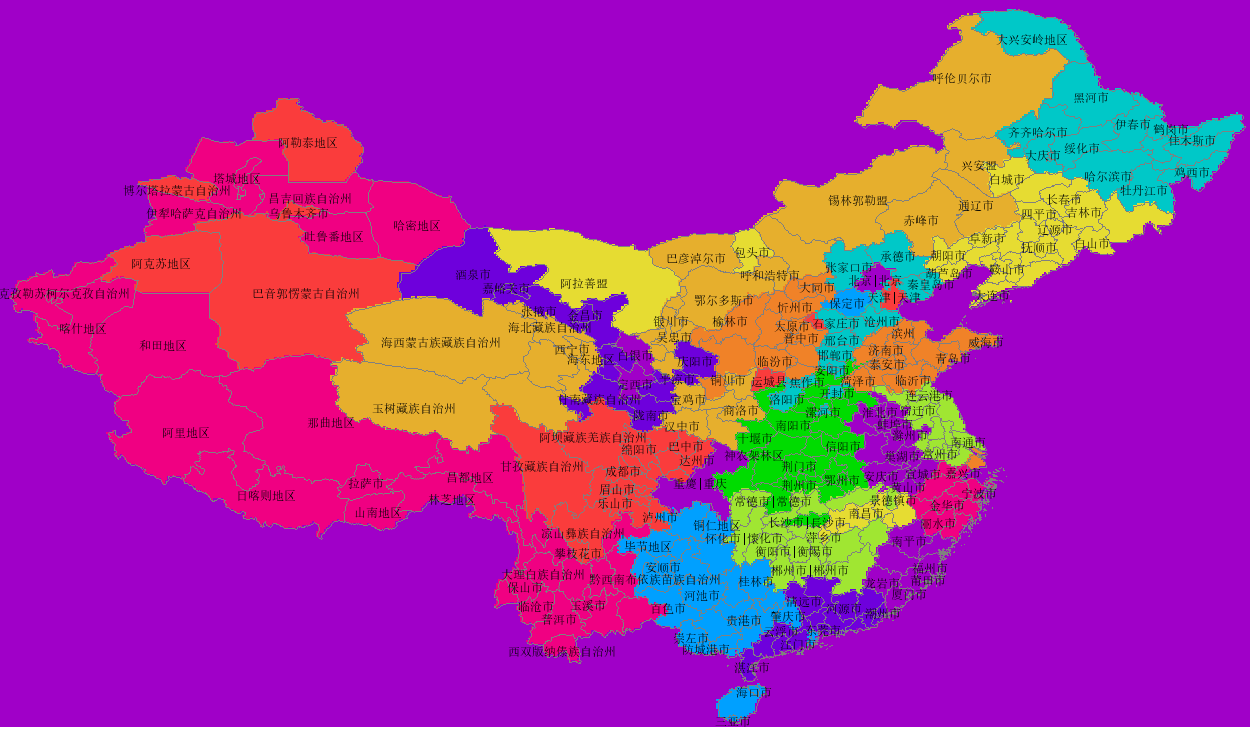
发布 省、市、县三个shapefile图层

在每个图层的style中设置显示的缩放级别和显示的样式

1
2
3
4
5
6
7
8
9
10
11
12
13
14
15
16
17
18
19
20
21
22
23
24
25
26
27
28
29
30
31
32
33
34
35
36
37
38
39
40
41
42
43
44
45
46
47
48
49
50
51
52
53
54
55
56
57
58
59
60

<?xml version="1.0" encoding="ISO-8859-1"?>
<StyledLayerDescriptor version="1.0.0"
xsi:schemaLocation="http://www.opengis.net/sld StyledLayerDescriptor.xsd"
xmlns="http://www.opengis.net/sld"
xmlns:ogc="http://www.opengis.net/ogc"
xmlns:xlink="http://www.w3.org/1999/xlink"
xmlns:xsi="http://www.w3.org/2001/XMLSchema-instance">
<!-- a named layer is the basic building block of an sld document -->

<NamedLayer>
<Name>Default Polygon</Name>
<UserStyle>
<!-- they have names, titles and abstracts -->

<Title>A boring default style</Title>
<Abstract>A sample style that just prints out a grey interior with a black outline</Abstract>
<!-- FeatureTypeStyles describe how to render different features -->
<!-- a feature type for polygons -->

<FeatureTypeStyle>
<!--FeatureTypeName>Feature</FeatureTypeName-->
<Rule>
<Name>Rule 1</Name>
<Title>GreyFill BlackOutline</Title>
<Abstract>Grey fill with a black outline 1 pixel in width</Abstract>

<MinScaleDenominator>100000</MinScaleDenominator>
<MaxScaleDenominator>7000000</MaxScaleDenominator>
<!-- like a linesymbolizer but with a fill too -->
<PolygonSymbolizer>
<Fill>
<CssParameter name="fill">#AAAAAA</CssParameter>
<CssParameter name="fill-opacity">0</CssParameter>
</Fill>
<Stroke>
<CssParameter name="stroke">#aaa</CssParameter>
<CssParameter name="stroke-width">0.5</CssParameter>
</Stroke>
</PolygonSymbolizer>

<TextSymbolizer>
<Label>
<ogc:PropertyName>NL_NAME_2</ogc:PropertyName>
</Label>
<Font>
<CssParameter name="font-family">SimSun</CssParameter>
<CssParameter name="font-size">12</CssParameter>
<CssParameter name="font-style">normal</CssParameter>
<CssParameter name="font-weight">bold</CssParameter>
</Font>
</TextSymbolizer>


</Rule>

</FeatureTypeStyle>
</UserStyle>
</NamedLayer>
</StyledLayerDescriptor>

发布图层组就可以预览了,还可以发布瓦片服务WMTS, 生成瓦片缓存。方便leaflet中调用。

Hello World

Posted on 2020-03-14 | | Visitors:

Welcome to Hexo! This is your very first post. Check documentation for more info. If you get any problems when using Hexo, you can find the answer in troubleshooting or you can ask me on GitHub.

Quick Start

Create a new post

1
$ hexo new "My New Post"

中文帮助

More info: Writing

Run server

1
$ hexo server

More info: Server

Generate static files

1
$ hexo generate

More info: Generating

Deploy to remote sites

1
$ hexo deploy

More info: Deployment

postgresql+nuxt 搭建 graphL 应用

Posted on 2019-08-07 | | Visitors:

服务端

获取docker 运行脚本

$ wget https://raw.githubusercontent.com/hasura/graphql-engine/master/install-manifests/docker-run/docker-run.sh

启动 docker-run.sh 脚本

docker run -d -p 8080:8080 -e HASURA_GRAPHQL_DATABASE_URL=postgres://postgres:postgres@localhost:5433/myapp_development -e HASURA_GRAPHQL_ENABLE_CONSOLE=true hasura/graphql-engine:latest

前端

按照文档修改成自己后台的地址和表、字段名称,访问首页可以看到自己的数据了

用meteoinfo和shapefile制作grads格式的mask文件

Posted on 2019-08-02 | | Visitors:

准备数据模板ctl和grd

在meteoinfo中 工具->输出地图数据->选择shape图层->output Format 选 GrADS Maskout file。即可生成mask文件,命名为mask.ctl

用meteoinfoLab 编写脚本 打开刚生成的 ctl 文件

1
2
3
4
5
6
7
8
9
10
11
12
13
14
15
16
17
18
19
20
21
22
23
24
25
26
27
28
29
30
31
32

path = 'D:/share/map'
regionShp = os.path.join(path, 'CHN_adm2.shp')
proj = projinfo()
glayer = shaperead(regionShp)

glayer.project(proj)
features = glayer.shapes()

n = len(features)

f = addfile('D:/share/tmp/mask.ctl')
data = f['mask'][0,:,:]
firstime = True

print data.shape
print f.proj

for i in range(n):
feature = glayer.shapes()[i]
tdata = data.inpolygon(feature)
#Change -1 to 0
tdata[tdata==-1] = 0
tdata = tdata * i
if firstime:
mdata = tdata
firstime = False
else:
mdata = mdata + tdata
mdata = mdata.astype('float')
binwrite('D:/share/tmp/mask.dat', mdata, append=False)

在meteoinfo 中打开mask.ctl,画图为

用predctionI搭建污染推荐系统

Posted on 2019-08-01 | | Visitors:

开始搭建PredictionIO服务器

docker 环境

Rails中重置PostgreSQL 自增主键的值

Posted on 2016-06-11 | | Visitors:

重置单个表 在rails console中执行以下代码:

1
2
3
4
5
table = 'my_table'
auto_inc_val = 10 # New auto increment start point
ActiveRecord::Base.connection.execute(
"ALTER SEQUENCE #{table}_id_seq RESTART WITH #{auto_inc_val}"
)

重置所有表 在rails console中执行以下代码:

1
2
3
4
5
6
7
8
ActiveRecord::Base.connection.tables.each do |table|
result = ActiveRecord::Base.connection.execute("SELECT id FROM #{table} ORDER BY id DESC LIMIT 1")
if result.any?
ai_val = result.first['id'].to_i + 1
puts "Resetting auto increment ID for #{table} to #{ai_val}"
ActiveRecord::Base.connection.execute("ALTER SEQUENCE #{table}_id_seq RESTART WITH #{ai_val}")
end
end

刘斌

6 posts
4 tags
© 2020 刘斌
Powered by Hexo
|
Theme — NexT.Muse v5.1.4